The Business Model Scorecard: How to Build Your Business Model Measurement System
A strategy without measurement is just a guess. Learn how to design a business model scorecard that aligns metrics to your North Star, assigns ownership, and tracks success across ten key components—from value proposition to cost structure—with actionable insights and real targets.

Your leadership team just finished strategic planning. You have a clear business model. You know your value proposition, your customer segments, your revenue streams.
But when someone asks "How do we know if this is working?" the room goes quiet.
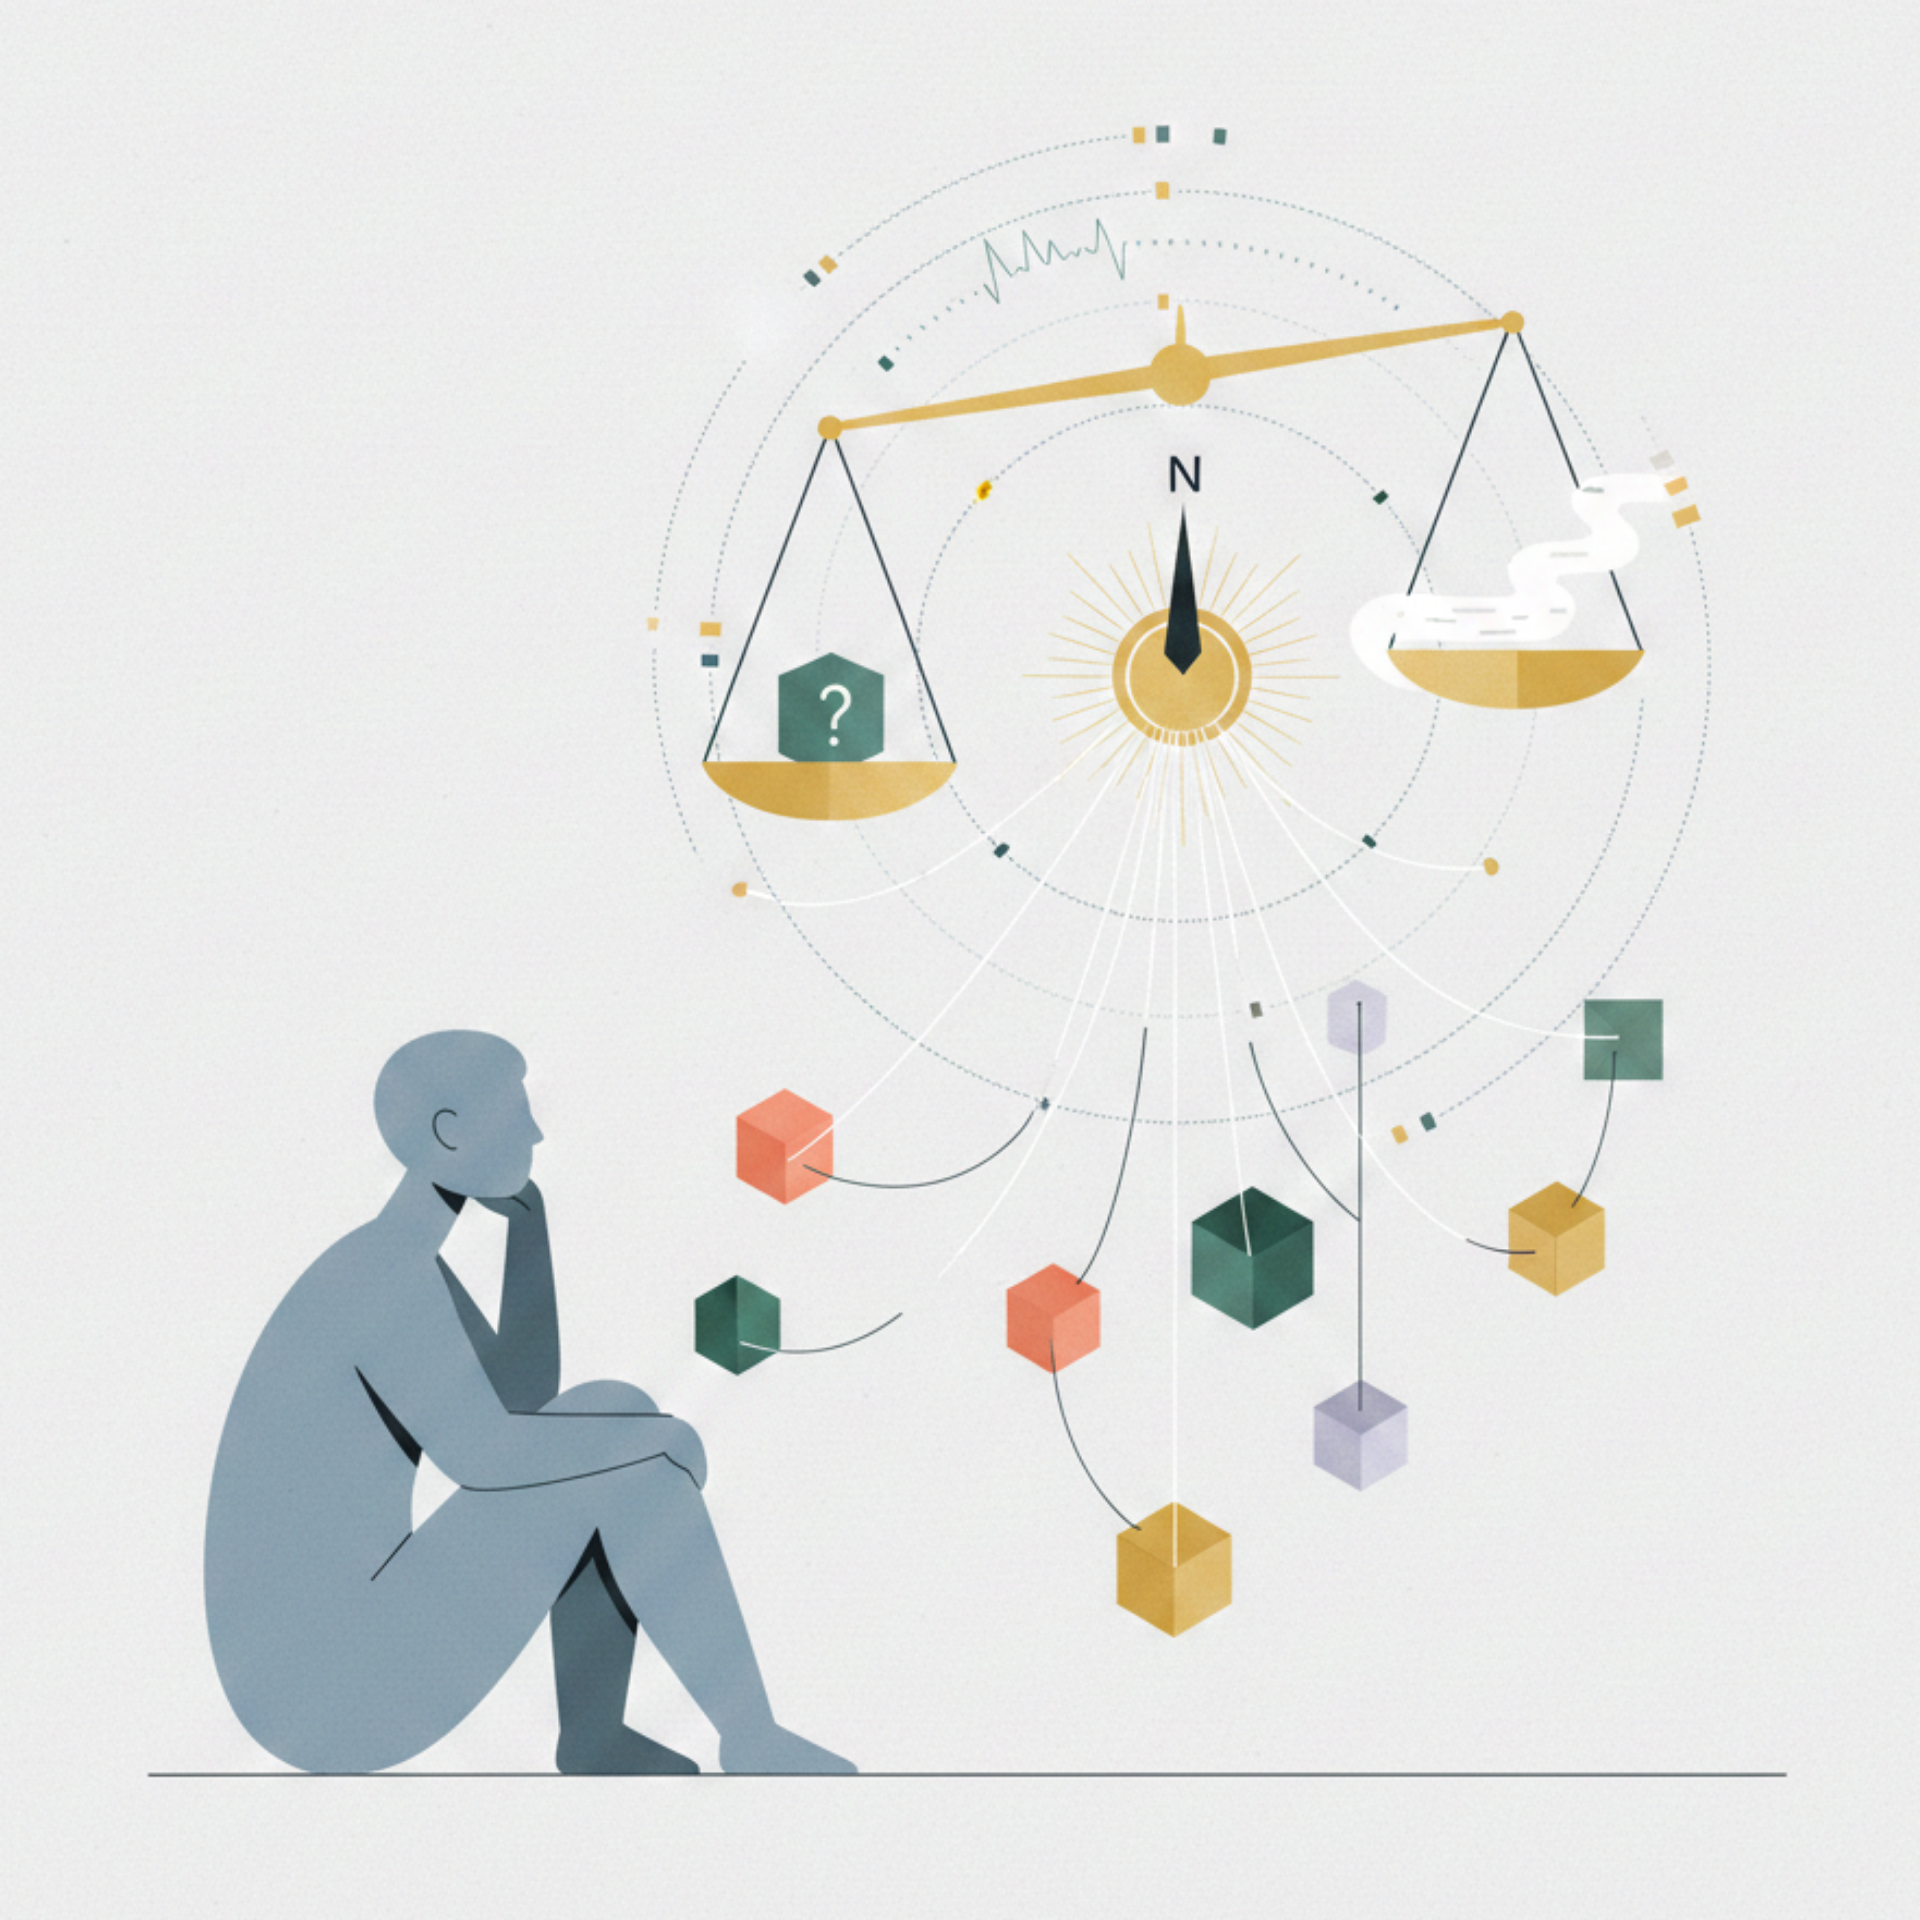
You have a strategy. You don't have a measurement system.
The Lean Business Model Scorecard
Teams build KPI systems that can't connect because they're using different frameworks and terminology. PATH fixes this— a design system for building compatible KPI frameworks using shared components and structure.
The Missing Link Between Strategy and Execution
Most companies build their business model once—usually on a whiteboard or in a slide deck during a planning session. Then they execute. Teams get busy. Metrics get tracked. Dashboards get built.
But nobody connects the dots. The metrics teams track daily don't map back to the business model components that drive success.
Revenue teams track bookings and pipeline. Product teams track feature adoption. Operations teams track efficiency. Customer Success teams track retention. All important metrics. But they don't form a system that tells you whether your business model is working.
You can't answer basic questions: Is our value proposition resonating? Are our channels efficient? Which ones drive the best customers? Are our key partnerships contributing? What's the ROI? Is our cost structure sustainable as we scale?
This isn't a strategy problem. It's a measurement design problem.
What a Business Model Scorecard Actually Does
A real business model measurement system connects three things.
Your North Star Metric: The single metric that best captures the core value you deliver to customers. When this goes up, everything else tends to follow.
Netflix tracks hours watched per subscriber. Spotify measures time spent listening per user. Airbnb counts nights booked. Slack monitors daily active users sending messages.
Your North Star isn't revenue—it's the leading indicator of sustainable revenue growth.
Component Metrics: Every component of your business model needs measurable outcomes. Value Proposition connects to customer satisfaction and adoption. Customer Segments to engagement and growth. Channels to conversion efficiency. Revenue Streams to financial performance. Your resources, activities, partnerships, and costs all need metrics that show whether they're working.
Clear Accountability: Every metric has an owner. Every owner has targets. Everyone sees how their metrics connect to the North Star.
When teams can see this connection, behavior changes. Marketing optimizes for channel efficiency, not just traffic. Product prioritizes features that drive the North Star, not just features customers request. Operations focuses on the activities that matter most.
The Ten Components to Measure
Your business model has ten critical components. Each one needs metrics that tell you whether it's working.
1. North Star Metric
This is your compass. Everything else should ladder up to moving this metric.
Choose something that reflects customer value, not just company revenue. It should predict long-term success and be measurable and movable by your team.
Spotify aims to increase average listening time per user by 20% through better playlist recommendations. Netflix targets growing hours watched per subscriber by 15% via improved content recommendations.
Ownership: CEO, Chief Product Officer
2. Value Proposition
Your offering needs to deliver on its promise. Most teams track product metrics but never connect them to customer perception of value.
Track conversion rate—do people choose your solution? Monitor Net Promoter Score—would they recommend it? Measure feature adoption for your unique capabilities and service uptime for reliability.
Set specific targets: 5% conversion rate, NPS above 50, 99.9% uptime.
Ownership: Product, Customer Success
3. Customer Segments & Engagement
Growth matters, but growth in the right segments matters more. Teams often track total users without segmenting by quality or cohort performance.
Monitor daily and monthly active users by segment. Track new user registrations by cohort. Measure customer acquisition rate by segment and retention rate by customer type.
Aim for 10% month-over-month growth in active users, 70% retention for newly acquired customers, 50% DAU/MAU ratio in your target segment.
Ownership: Growth, Product Marketing
4. Customer Relationships
The quality of customer interactions predicts retention. Support teams track ticket volume but rarely measure relationship quality or its impact on keeping customers.
Measure average response time, customer satisfaction score (CSAT), repeat purchase rate, and customer effort score. Target response times under 5 minutes, CSAT of 90%, and 30% repeat purchase rate.
Ownership: Customer Success, Support
5. Channels & Market Reach
Not all channels perform equally. Marketing teams track channel metrics in isolation without comparing efficiency or the quality of customers each channel produces.
Track website visits by channel, mobile app engagement, channel conversion efficiency, geographic penetration, and customer acquisition cost by channel.
Achieve 4% conversion on mobile app. Increase website traffic by 20% year-over-year in target regions. Reduce CAC by 15% in top-performing channels.
Ownership: Marketing, Growth
6. Revenue Streams
Revenue growth tells you something. Revenue growth by stream, with margin analysis, tells you everything. Finance tracks total revenue but often doesn't break down growth, profitability, and efficiency by revenue stream.
Monitor revenue growth rate by stream, average revenue per user (ARPU), gross margin by product line, net margin, and ROI by revenue stream.
Target 15% annual revenue growth, ARPU of $50, and gross margin of 40%.
Ownership: Finance, Sales, Product
7. Key Resources
Your critical assets need to work hard. Operations tracks resources but rarely measures whether they're being used effectively relative to business outcomes.
For tech businesses, platform uptime matters. For all businesses, employee productivity, asset utilization rate, and capital efficiency matter.
Ensure 99.9% system uptime. Increase employee productivity by 10% per quarter. Launch 3 new features annually with your existing team.
Ownership: Operations, Engineering, HR
8. Key Activities & Operations
Completing activities isn't enough—speed and quality matter. Teams track activity completion but not the impact on customer experience.
Measure cycle time for critical processes, order processing time, process efficiency ratios, quality and error rates, and sales velocity.
Reduce order processing time to under 30 minutes. Maintain process error rate below 2%. Shorten cycle time by 15%. Improve sales velocity by 25%.
Ownership: Operations, Process Management
9. Key Partnerships
Partnerships that don't contribute measurably don't deserve resources. Companies track that partnerships exist but rarely measure their actual business impact.
Track partner revenue contribution, integration efficiency, co-marketing success, and time-to-market improvement via partnerships.
Achieve 25% revenue contribution from partner channels. Reduce integration time to 2 weeks. Increase referrals by 10% via co-marketing.
Ownership: Partnerships, Business Development
10. Cost Structure
Costs that don't scale with revenue will kill you. Finance tracks total costs but doesn't always tie cost metrics to revenue or efficiency ratios that reveal sustainability.
Monitor operating expense ratio (OpEx/Revenue), cost per acquisition (CPA), cost of goods sold (COGS), and efficiency ratios like cost per transaction or cost per user.
Keep operating expenses under 30% of revenue. Achieve CPA below $50. Reduce COGS by 10% over the next year.
Ownership: Finance, Operations
Building Your Scorecard
Start with your North Star. Ask: When customers get value from us, what are they doing? What metric, if it grows, predicts long-term business success? Can our team actually move this metric?
Map metrics to each component. For each of the ten components, choose 2-4 metrics. At least one leading indicator that predicts future performance. At least one lagging indicator that confirms outcomes. Don't track everything. Track the vital few that tell you if each component is working.
Set clear targets. Define your One Metric That Matters (OTM)—the single most important metric for a component right now. Then add 2-3 KPIs that support or validate it. For Customer Engagement, your OTM might be 10% month-over-month growth in active users, with KPIs of 70% retention rate for new customers and 50% DAU/MAU ratio.
Assign ownership. Every metric needs one person or team accountable for moving it. The North Star belongs to your CEO or CPO. Value Proposition to Product. Customer Segments to Growth or Marketing. Customer Relationships to Customer Success. Channels to Marketing. Revenue Streams to Finance and Sales. Key Resources to Operations. Key Activities to Operations. Key Partnerships to Partnerships or BD. Cost Structure to Finance.
Build visibility across the system. Create one shared view where everyone can see the North Star and how it's trending, all component metrics and their targets, and how each component contributes to the North Star. This visibility creates alignment. When Product sees that feature adoption drives the North Star, they prioritize differently. When Marketing sees that certain channels produce higher-quality customers, they reallocate budget.
Review and adapt quarterly. Your business evolves. Your scorecard should too. Every quarter, review which metrics still matter, retire metrics that don't drive decisions, add new metrics for emerging priorities, and adjust targets based on what you've learned.
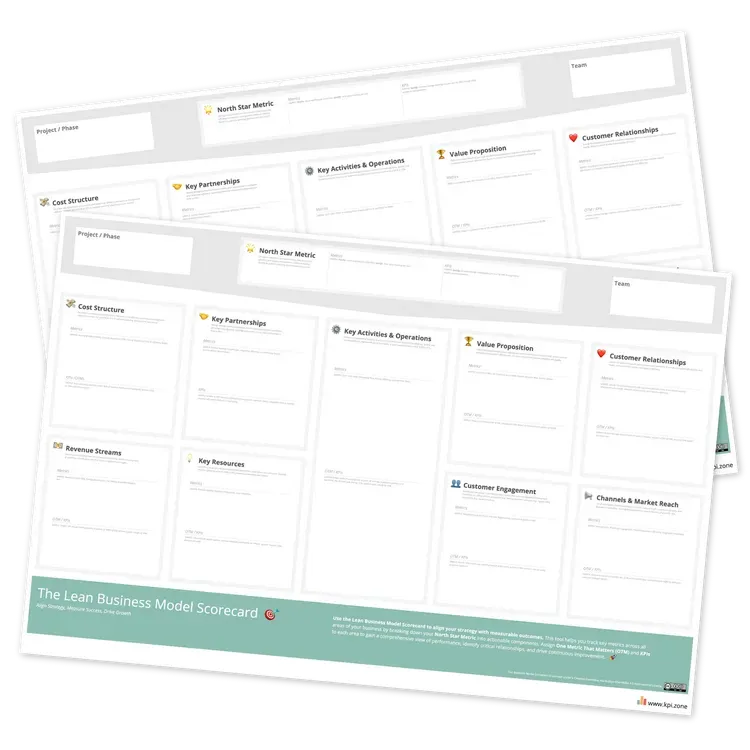
Using the Lean Business Model Scorecard
The Lean Business Model Scorecard is a visual framework that maps all ten components of your business model with space to define metrics, your OTM or KPIs, targets, and ownership.
Download the Lean Business Model Scorecard → [link]
Fill in the center. What's the one metric that captures the value you deliver? This is your North Star.
Map component metrics. For each of the ten business model blocks, identify the 2-4 metrics that matter most. Use the examples above as a starting point, then adapt to your business.
Set targets. Define your OTM and KPIs for each component. Make them specific and measurable. "Grow revenue 50%" isn't actionable. "Increase ARPU by $10 through feature adoption" tells you exactly what to do.
Assign ownership. Use the "Team" field to note who's responsible for each component. One owner per metric, not "Marketing and Sales co-own customer acquisition."
Make it visible. Print it. Put it on the wall. Share it digitally. Make sure everyone can see how their work connects to the North Star.
Update it regularly. What mattered at $5M ARR doesn't matter at $20M. Treat this as a living document. Review quarterly and evolve.
Common Mistakes
The first mistake is tracking too many metrics. More dashboards don't equal better decisions—they equal paralysis. Pick the vital few that actually drive action, then stop.
The second mistake is avoiding clear ownership. "Marketing and Sales co-own customer acquisition" means nobody owns it. Assign one owner per metric. If it trends wrong, someone specific should feel responsible.
The third mistake is ignoring the connections. The power of a scorecard is seeing how components connect. Don't measure channels without connecting them to customer quality and revenue outcomes. The system reveals insights that isolated metrics hide.
The fourth mistake is setting vanity targets. "Grow revenue 50%" sounds impressive but doesn't tell your team what to do. "Increase ARPU by $10 through feature adoption" is actionable and measurable.
The fifth mistake is never updating it. What mattered at $5M ARR doesn't matter at $20M ARR. Review quarterly and evolve. Your business changes. Your scorecard should change with it.
Start This Week
You don't need a perfect scorecard to begin.
Monday: Identify your North Star Metric. What best captures customer value? When customers get value from you, what are they doing? Write it down.
Tuesday: Pick your weakest business model component. Which block is underperforming or unmeasured? Revenue streams? Partnerships? Customer relationships?
Wednesday: Define 2-3 metrics for that component. What would tell you if it's working? Pick one leading indicator and one lagging indicator at minimum.
Thursday: Set targets and assign ownership. Make targets specific. Make ownership singular—one person or team per metric.
Friday: Share it with your team. Discuss what it reveals. What patterns emerge? What will you change based on what you're measuring?
Once you've instrumented one component well, expand to the next. The goal isn't a complete scorecard on day one. The goal is connecting your strategy to measurable outcomes so you know what's working.
The Lean Business Model Scorecard
Teams build KPI systems that can't connect because they're using different frameworks and terminology. PATH fixes this— a design system for building compatible KPI frameworks using shared components and structure.
Written by

Subscribe to my newsletter
Subscribe to my newsletter to get the latest updates and news