The Pirate Canvas: How to Map Your Growth Funnel
Healthy growth starts with visibility. Map your funnel using the AAARRR framework to find your weakest conversion point, fix broken handoffs, and run high-impact experiments. Stop guessing where growth breaks—start diagnosing and optimizing with the Pirate Canvas.


You just reviewed your growth metrics. Signups are up. Revenue is growing. Everything looks healthy.
But when you dig deeper, the picture changes. Only 15% of signups activate. Half your users never come back after week one. Your referral program exists but nobody uses it.
You have a funnel. You don't have a map of where it's broken.
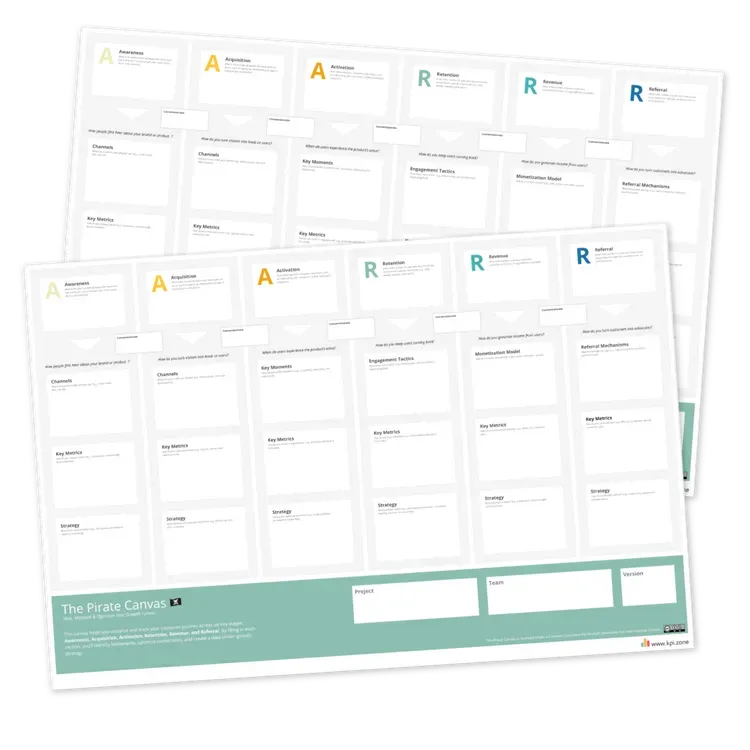
The AAARRR Pirate Funnel Canvas
You know the funnel stages. But where are customers dropping off? This canvas maps your full customer journey: tracking users, conversion rates, and bottlenecks across Awareness through Referral. So you know exactly where to focus next.
The Invisible Funnel Problem
Most companies track metrics at each stage of their customer journey. But they track them in isolation.
Marketing reports on awareness and acquisition. Product reports on activation and engagement. Finance reports on revenue. Nobody connects the stages to see where the real problems hide.
You know each stage's performance, but you don't know where customers are getting stuck between stages.
You see 10,000 website visitors this month, 500 signups, 100 activated users, 30 paying customers. You don't see why 9,500 visitors didn't sign up, why 400 signups never activated, why 70 activated users didn't convert, or which stage is the biggest constraint on growth.
This isn't a tracking problem. It's a mapping problem.
What a Growth Funnel Map Actually Reveals
A complete growth funnel map shows you three critical things.
Where customers enter and exit. At each stage, you see the inflow, the outflow, and the conversion rate between them. This immediately reveals your biggest constraint. If awareness-to-acquisition converts at 40% but acquisition-to-activation converts at 5%, you know where to focus. More awareness won't help—you have an activation problem.
What happens at each stage. Not just the metrics, but the mechanisms. Which channels drive awareness? What triggers activation? Which tactics retain users? What encourages referrals? When you map mechanisms alongside metrics, you can experiment systematically.
How stages connect to each other. The quality of users you acquire affects activation rates. Activation speed affects retention. Retention affects the credibility of your referral asks. Stages aren't independent. When you see the connections, you optimize the system, not just individual stages.
The Six Stages of Every Growth Funnel
Every business—B2B or B2C, product-led or sales-led—moves customers through six stages. The AAARRR framework breaks them down.
Stage 1: Awareness
Before someone can use your product, they need to know you exist. This is the top of your funnel.
Are we reaching the right people? That's the question this stage answers.
Map where potential users discover you: social media, SEO, paid ads, PR, word-of-mouth, partnerships. Track impressions, website traffic, brand mentions, search volume. Your tactics might include viral content, influencer marketing, partnerships, or community building.
Your target: total people exposed to your brand.
Stage 2: Acquisition
Interest becomes action. Someone visits your website, downloads your app, or requests information.
Are we capturing the right people efficiently?
Users enter through landing pages, free trials, lead magnets, app store listings. Track signups, cost per lead, conversion rate, form completions. Optimize with A/B testing, clear CTAs, reduced friction, incentives.
Your target: visitors who take action—signup, download, subscribe.
Stage 3: Activation
This is the most critical stage. A user signed up. Now they need to experience why your product matters—fast.
Are new users discovering value quickly enough to stick around?
Define your key moments: completing onboarding, first transaction, first meaningful interaction, inviting teammates. Measure activation rate, time to first value, completion of key actions. Speed up activation with in-app guidance, personalized onboarding, empty state design, progressive disclosure.
Your target: new users who complete a key action that demonstrates value.
Most funnels break here. If you're losing 80% of signups before activation, no amount of marketing will fix your growth problem.
Stage 4: Retention
Activation gets users to experience value once. Retention makes it a habit.
Are users building lasting habits with our product?
Keep users active with email nudges, push notifications, loyalty programs, community features, gamification. Track daily and monthly active users, churn rate, cohort retention curves, engagement frequency. Prevent churn through personalized experiences, community building, customer success programs, continuous value delivery.
Your target: users who return and stay active within a specific timeframe.
Stage 5: Revenue
Free users become paying customers, or paying customers expand their spending.
Are we monetizing effectively without creating friction?
Your monetization model might be subscriptions, one-time purchases, usage-based pricing, upsells, add-ons. Measure ARPU (average revenue per user), LTV (lifetime value), conversion rate, payment success rate. Increase revenue through pricing optimization, upsell strategies, reducing churn, expanding account value.
Your target: paying customers, completed purchases, upgrades to paid plans.
Stage 6: Referral
Your happiest customers can become your best acquisition channel—if you design for it.
Are we making it easy and rewarding for customers to spread the word?
Build referral programs, incentives, social sharing features, word-of-mouth triggers. Track NPS (Net Promoter Score), viral coefficient, referral conversion rate, shares. Amplify referrals with social proof, gamification, exclusive perks, built-in sharing, network effects.
Your target: users who share your product via referrals, word-of-mouth, or invite programs.
The Conversion Rates That Matter
Between each stage, there's a conversion rate. This is where you find your constraints.
Your lowest conversion rate is your biggest constraint on growth.
Here's an example: Awareness to Acquisition converts at 5% (10,000 → 500). Acquisition to Activation at 20% (500 → 100). Activation to Retention at 80% (100 → 80). Retention to Revenue at 40% (80 → 32). Revenue to Referral at 25% (32 → 8).
Your constraint is Awareness to Acquisition at 5%. Even if you double awareness, you only add 500 more signups. But if you improve Acquisition to Activation from 20% to 40%, you double your activated users with the same awareness spend.
This is why mapping the full funnel matters. It shows you where leverage actually exists.
Where Funnels Break
Most funnels break at four predictable points.
Acquisition to Activation: High signup rates but low activation. Users sign up with interest but never experience enough value to stick around. Onboarding confuses them, empty states don't help, time-to-value drags. Map the activation journey. Identify the first moment of value. Design onboarding to get users there in under 5 minutes.
Activation to Retention: Good activation rates but terrible week-two retention. Users experience value once but don't build a habit. No triggers bring them back. No reason to return daily or weekly. Build retention loops—email nudges, push notifications, streak mechanics, fresh content, social features. Give users a reason to return.
Retention to Revenue: Strong engagement but weak monetization. Users love the free version but never hit a natural upgrade moment. Paywalls appear at frustrating times instead of delightful ones. Map the moments when users get maximum value. Introduce pricing when they're most likely to pay—when they want more, not when they hit a limit.
Revenue to Referral: Happy customers who never refer anyone. No systematic referral mechanism. You're waiting for organic word-of-mouth instead of designing for it. Build referral into the product. Ask at high-satisfaction moments. Make sharing easy and rewarding.
Using The Pirate Canvas
The Pirate Canvas is a visual framework for mapping your complete growth funnel across all six AAARRR stages.
Download The Pirate Canvas → [link]
The canvas helps you see what happens at each stage (channels, tactics, mechanisms), what you measure at each stage (key metrics), how you optimize each stage (strategy), and where customers convert or drop off (conversion rates).
Map your current state. For each of the six stages, fill in channels and mechanisms (how does this stage actually work today?), key metrics (what are you tracking?), strategy (what tactics are you using?), and conversion rate (what percentage move to the next stage?). Be honest. Don't map what you wish you were doing. Map what's actually happening.
Identify your constraint. Look at your conversion rates between stages. Which is lowest? That's your primary constraint on growth.
Diagnose the breakpoint. For your lowest-converting stage, ask: Why are people dropping off? What's missing in this experience? What would need to change to improve conversion by 2x?
Design experiments. Based on your diagnosis, design 2-3 experiments to improve that stage's conversion rate. Test them. Measure results. Double down on what works.
Move to the next constraint. Once you've improved your biggest constraint, it might no longer be your biggest constraint. A new bottleneck emerges. Map the new constraint and optimize it.
Review quarterly. Your funnel evolves as your product and market mature. What mattered at 1,000 users won't matter at 100,000. Review your canvas quarterly. Update the mechanisms, metrics, and strategies that have changed.
The AAARRR Pirate Funnel Canvas
You know the funnel stages. But where are customers dropping off? This canvas maps your full customer journey: tracking users, conversion rates, and bottlenecks across Awareness through Referral. So you know exactly where to focus next.
Written by

Subscribe to my newsletter
Subscribe to my newsletter to get the latest updates and news